Happy customers are the backbone of every business. They grow your revenues, bring repeat business and spread the good word about your brand. A great customer experience goes a long way in making customers happy. One of the best ways to boost your support and provide a great customer experience is to know what your customers want from your product or service. However, you don’t have to explicitly ask them about it. Tracking relevant metrics can give you an honest & clear understanding of their overall satisfaction. Here are 5 Customer Service Metrics you must monitor regularly:
1. Incident Volume
It’s important to monitor the volume of calls and inquiries you get daily. It helps you find out if there is any rush of support traffic at certain times of the day. This will tell you when you should allocate most employees & resources to customer service. Although your business has working hours, your customers may run on a different schedule. They’ll try to reach you as soon as they face an issue. You can note the most frequently called times and prepare for it, even if they’re outside your business hours.
It’s also necessary to monitor volume of support incidents by various channels such as emails, telephone & social media. Different channels require different types of support staff & resources. Breaking out support incidents by channels helps you identify which channel needs more attention, and adapt quickly.
2. First Response Time
Do you like waiting for a response when you are facing an issue? First Response Time is the amount of time taken for your business to respond to a customer issue. It is one of the most important metric that affects customer satisfaction. If you keep the customer waiting, you are likely to bring down customer satisfaction considerably. Studies show that 53% of customers feel 3 minutes to be a reasonable response time while waiting for a customer support agent over the phone. Customers also believe that 24 hours is reasonable to get response by email.
You can measure First Response Times by various channels to identify which channel needs more attention. Even within a single channel such as email, you can group the number of responses based on the amount of time taken. How many responses were sent within 1 hour, 2-6 hours, 6-12 hours, etc.? This will show you the distribution of your responses over time. You can find out the most frequent support issues which increase first response time, and assign more resources to them. You can also monitor first response times for each support agent. This will tell you which agents take time to respond, and could use more training and assistance.
3. Resolution Time
Resolution Time is the amount of time taken to resolve a customer issue. Average Call Resolution Time shows the overall effectiveness of your customer service. Shorter the resolution time, better your customer service. Many factors contribute to high resolution time. It can be due to the communication skills or technical expertise of the customer or your support agent. It can also be because the agent doesn’t have access to relevant resources. You can monitor resolution time for each type of customer issue to identify which ones take the longest to be resolved. You can also track it for each support agent. This will help you find out the root cause of delay and solve it immediately.
4. Abandonment Rates
Abandonment rate is the percent of customers who hang up the phone or leave the queue before they reach a customer service agent. Long hold times and a confusing support system are the most common reasons why customers drop off. You can track abandon rates over time to find out which days of the week it increases, or which time of the day you are flooded with support calls. This will help you increase your capacity accordingly. You can also look at the abandon rate at each step of your support such as the initial welcome message, IVR navigation or the automated wait message. Once you know which step has the highest abandon rate, you can identify the source and fix it as soon as possible.
5. First contact resolution
First contact resolution tells you how many issues were resolved during the initial engagement. Greater this number, the better it is. To maximize this metric, you have to find out which issues are escalated beyond the first contact, on which channels and why. So you need to break out this metric by various channels and type of customer issues. It helps you identify the reasons for escalation and resolve them quickly.
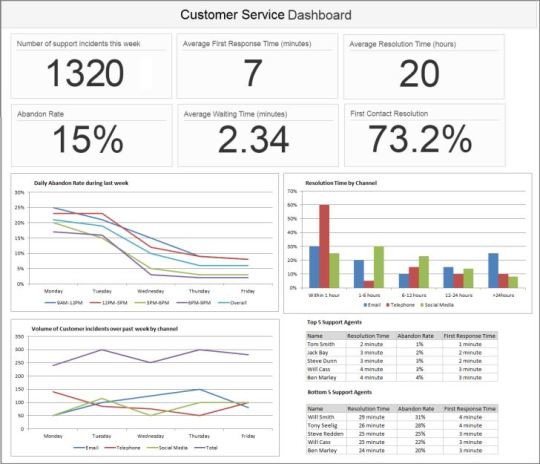
You can create a simple customer service dashboard to regularly monitor the status of your customer support. Reviewing it daily/weekly will tell you about the performance of your customer service. It will help you measure customer satisfaction, identify areas of improvement and take action immediately. You can add more metrics to it when you feel the need to track more information.

Measuring the performance of your customer service enables you to rapidly improve it. It allows you to easily identify the key pain points of your customers, areas which need additional resources and support agents that can benefit from additional training. You can even streamline support by automating frequent responses and creating Knowledge Base or FAQs. This helps you improve your product or service, boost customer experience and grow your business faster.
Image via Shutterstock
This article was syndicated from Business 2 Community: 5 Customer Service Metrics Every Business Should Be Tracking
More Sales & Marketing articles from Business 2 Community:


