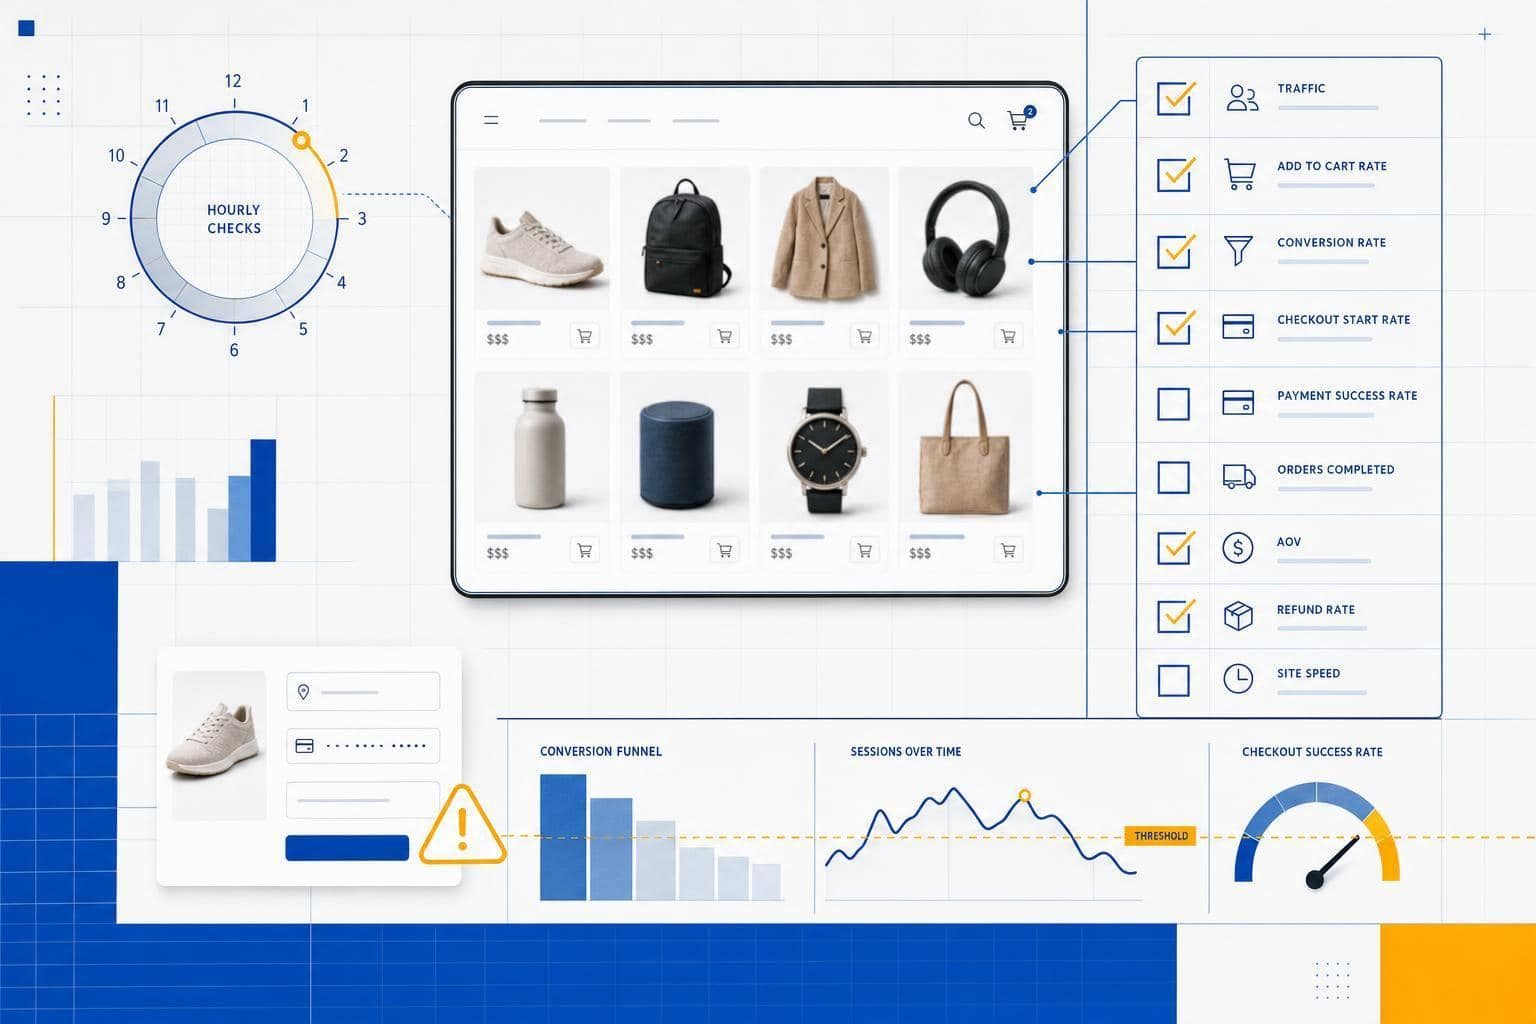
Traffic spikes can turn into lost sales fast if you watch the wrong numbers. I’d keep this simple: track a short list of sales, checkout, speed, and payment KPIs, and check them on a set schedule. Below, I’ll show you which numbers matter most, where trouble usually starts, and what to do before, during, and after the event.
Peak days are not the time to stare at every chart. I’d watch the numbers tied to money first: orders per hour, revenue per hour, and conversion rate by device.
If visits go up and orders stay flat, I’d assume the funnel has a problem until proven otherwise. That usually means a broken button, a slow step, or a payment issue.
I’d also keep cart abandonment and checkout completion in view. They tell you if shoppers are backing out before they pay, or if the checkout itself is failing. A cart abandonment jump of 15% above your holiday baseline is a clear warning sign.
On the site side, I’d watch checkout error rate, mobile LCP – Largest Contentful Paint, or how long the main page content takes to appear – and payment failure rate. Those three explain why shoppers leave even when your store still looks “up.”
A few numbers from the article stand out:
- Stores that stick to a short KPI list respond to problems 3.2x faster
- Mobile LCP at 3.0 seconds or less is healthy
- Mobile LCP above 4.0 seconds needs action
- A 97%+ payment approval rate is healthy
- Below 95% payment approval is danger territory
- A 0.1-second mobile speed gain can lift retail conversions by 8.4%
I would not rely on traffic alone. Traffic can spike while revenue slips, and that’s how teams miss quiet checkout failures.
What I like here is the order of checks. Start with sales pace. Then check conversion. Then move into checkout errors, speed, and payment methods by device. That path gets you to the problem faster than jumping between random reports.
I’d also keep the dashboard to one screen. Put Sales, Conversion, Checkout Health, Site Speed, and Payments in one view, and use the same alert colors across all of them. If a metric is within 10% of forecast, it’s fine. If it drops 10%–20%, watch it. If it falls more than 20%, act fast.
Before the event, I’d set targets, assign one person to watch the dashboard, freeze non-critical code changes 3–5 days before launch, and test checkout on mobile and older browsers. After the event, I’d review the same KPIs within 24–48 hours and put a dollar figure on each dip, like a $1,200 loss during a 40-minute checkout issue.
If you want the short version, it’s this: don’t monitor everything. Watch the few numbers that tell you if shoppers can browse, add to cart, and pay without friction. Then build your checklist around those numbers and use the same view before, during, and after every big sales day.
Check sales momentum first: are orders and revenue on track?
Start here: watch orders and revenue hour by hour. These numbers tell you fast whether the event is working or whether something is quietly going wrong.
Don’t check traffic first. A spike in visits can look good while sales are stalling.
Orders per hour
Orders per hour tells you how many sales you’re closing each hour. During a high-traffic event, it’s your clearest early warning sign.
Compare your live order pace against your target. If traffic goes up but orders don’t, that usually means something is broken in checkout – like a bad button, a script error, or a payment problem.
This is why orders per hour matters so much. Your server dashboard can look fine while a checkout button fails or a mobile payment flow stops working.
If traffic rises but orders stay flat, the issue is probably in the funnel, not the audience. Check the buying path right away.
Revenue per hour
Revenue per hour tells you whether that traffic is turning into actual sales dollars, not just extra visits. If traffic is high but revenue per hour is low, you likely have a funnel issue.
Check conversion rate and checkout errors immediately. That’s usually where the problem shows up first.
Revenue per hour adds the dollar amount behind your sales pace. Use it alongside orders per hour to see if the event is tracking against plan.
If either number drops, move next to conversion and checkout KPIs.
Is your traffic turning into sales?
Watch these funnel numbers during the event. They show where sales start slipping, so you can fix the right problem before revenue takes a bigger hit.
Conversion rate
Conversion rate is orders divided by sessions. Check it every 30–60 minutes and break it out by device[1].
Look at mobile and desktop on their own. Your total conversion rate can seem flat while mobile shoppers are stuck with a broken checkout button and quietly leaving[1].
If conversion drops, move straight to cart abandonment and checkout completion next.
Cart abandonment rate
Cart abandonment rate shows the gap between shoppers who meant to buy and shoppers who finished the order: (carts created − orders) ÷ carts created[1]. Check it every 1–2 hours during your event[1].
A spike usually means something is going wrong in checkout. Common causes are shipping surprises, coupon failures, payment errors, or slow checkout pages[1].
If cart abandonment jumps 15% above your holiday baseline, test the full checkout flow on multiple devices right away[1]. Don’t wait for customer complaints.
Checkout completion rate
Checkout completion rate is orders divided by the number of shoppers who started checkout[1]. This is the number that helps you tell the difference between a traffic problem and a broken checkout.
If conversion rate drops but checkout completion stays steady, the problem is likely earlier in the funnel. If checkout completion drops, the checkout itself may be failing[1].
A drop of more than 5% below baseline is a risk[3].
- 0% to +10%: healthy
- 1% to 5% below baseline: needs review
- More than 5% below baseline: act right away
Set these three KPIs on one live dashboard and check them by device during the event. That makes it much easier to spot trouble before it turns into lost orders.
Are technical problems hurting your sales?
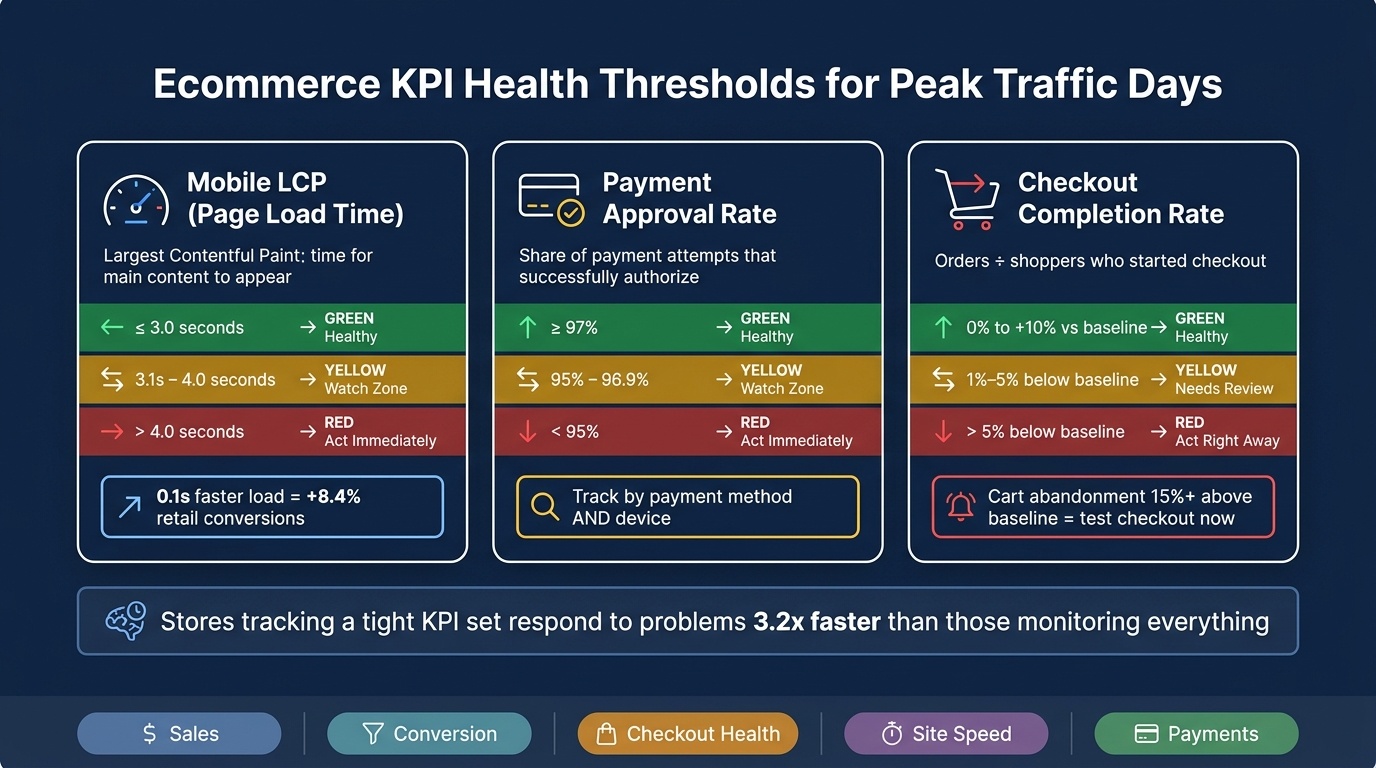
Ecommerce KPI Thresholds for High-Traffic Days
Watch technical KPIs right next to your sales numbers. Sales funnel KPIs show where people drop off. Technical KPIs show why they leave.
During high-traffic events, small problems can drain revenue without setting off the usual alarms. Your servers can look fine, while shoppers hit errors and quietly bounce.
Checkout error rate
Track checkout error rate by step, not just as one big number. You want to see errors in shipping, payment, and confirmation separately.
That matters because traffic spikes often expose problems on just one browser or one device. A form field might fail in one browser, or the shipping step might break on mobile, while the rest of the store still works.
Device-specific issues make up 31% of holiday technical failures, but stores that only watch top-level metrics miss them in 73% of cases [1].
Set automated alerts for sudden spikes. If checkout errors jump, your team should check it within minutes, not hours.
Page load time
Track mobile LCP – Largest Contentful Paint, which means how long it takes the main content on the page to show up. This is one of the clearest speed signals for mobile shoppers.
Peak traffic can slow tags, pixels, and apps even when your server looks healthy. So if you only watch server uptime, you can miss the thing your customers actually feel: a slow page.
Mobile LCP of 3.0 seconds or less is healthy. Above 4.0 seconds is high risk [3].
Improving mobile load time by just 0.1 seconds can increase retail conversions by 8.4% [2].
| Mobile LCP (p75) | Status |
|---|---|
| ≤ 3.0s | Healthy |
| 3.1s – 4.0s | Watch zone |
| > 4.0s | Act immediately |
Add mobile LCP to your live reporting now, especially during sales events and holiday traffic spikes.
Payment failure rate
Track payment failure rate by payment method and device. This metric shows the share of payment attempts that do not authorize.
A 97%+ authorization success rate is healthy. Below 95% is high risk [3].
Common causes include processor timeouts, gateway outages, or failures tied to a specific payment method [3][2]. If Apple Pay works but credit cards fail on Android, you need to see that fast.
Put these three technical KPIs on one live dashboard with orders and revenue. That gives you one place to spot problems before they turn into lost sales.
How to keep KPI monitoring simple with the right tools
Keep your main sales and site-health numbers on one screen. That makes it much easier to spot trouble fast when traffic spikes.
When teams watch too many KPIs, they slow themselves down. Stores that track a tight set of core metrics respond to problems 3.2x faster than stores trying to watch everything [1].
Build a one-screen dashboard for peak days
Put your KPIs into five groups and show them on a single dashboard: Sales, Conversion, Checkout Health, Site Speed, and Payments. This gives you one place to check before and during busy sales periods.
Use the same color rules across the whole dashboard so nobody has to guess what’s normal. Set green for metrics within 10% of forecast, yellow for 10–20% variance, and red for anything past 20% [1].
Set automated alerts for payment failures. That matters because some payment issues quietly block orders without taking your whole site offline, and those silent failures are easy to miss if you’re only watching uptime [1][2].
| KPI Category | Specific Metric |
|---|---|
| Sales | Orders per hour / Revenue per hour |
| Conversion | Conversion rate by device |
| Checkout Health | Cart abandonment rate / Checkout error rate |
| Site Speed | Page load time (Mobile LCP) |
| Payments | Payment failure rate |
Use a platform that keeps your store data easy to access
Choose a platform that keeps store data in one place. If your ecommerce, payments, and hosting data live together, your team spends less time jumping between tools during peak traffic.
Turbify keeps ecommerce, payments, and hosting in one single platform, which simplifies monitoring during high-traffic periods [5].
Put this dashboard into your pre-event checklist, then keep it open for live event checks.
What to do during and after the event
Keep your dashboard live, then work in three phases: prepare, monitor, and review. The goal is simple: protect sales while traffic is high, then use the numbers to fix weak spots before your next push.
Build your pre-event checklist
Start prep at least two weeks out. Set target numbers for orders, revenue, conversion, checkout errors, and payment failures, then give one person clear ownership for pricing, fulfillment, and site issues before launch.
Freeze non-critical code changes and third-party script additions 3–5 days before the event. That cuts the risk of last-minute regressions – new bugs caused by recent changes [4].
Test the full checkout flow from start to finish. Pay extra attention to older Safari and mobile Chrome versions, because traffic-related errors often show up there first.
In that same 3–5 day window, preload your key landing pages and make sure backups and restore steps still work [4]. Also confirm your automated alerts before launch. Payment failures and 500-level errors – server-side crashes that stop pages from loading – should alert your team right away.
Use the launch checklist before the event. Then use that same KPI view after the event ends, so you’re comparing the same numbers instead of bouncing between reports.
Run a post-event review within 24–48 hours
Do the review within 24–48 hours after traffic drops. The data is still fresh, and your team will still remember what happened when things got messy.
Use the same KPIs to find the first point where things went wrong. Compare actual hourly revenue against your forecast to spot when performance dipped and what likely caused it.
Check conversion rates by device. Then audit your checkout funnel for abandonment spikes and error logs, including 404s, 500-level server errors, and third-party script failures.
Put a dollar amount on each dip. If you lost $1,200 during a 40-minute checkout issue, that gives you a clear case for fixing it before the next promotion.
Anything that caught you off guard during the live event should go straight onto next year’s checklist. That’s how you turn one rough sales day into a cleaner launch next time.
Conclusion: Focus your checklist on the KPIs that protect sales
Keep your KPI list short. On peak traffic days, the goal is simple: protect sales by watching the numbers that show what customers are buying, where the funnel is slipping, and whether the site stays up.
Track orders per hour, revenue vs. forecast, conversion rate by device, cart abandonment rate, checkout completion rate, checkout error rate, page load time, and payment approval rate. Those numbers tell you fast if sales are on track or if something is breaking.
Set your targets before the event. Watch the same KPIs during the rush, then run your post-event review within 24–48 hours while the data is still fresh [2].
Use that same KPI view for prep, live monitoring, and the review after the event. Then document what happened and update the checklist before the next surge.
FAQs
Which KPI should I check first during a traffic spike?
Start with hourly revenue and conversion rate. These two numbers tell you, fast, whether sales are on track or slipping.
Hourly revenue pacing means checking how much money you’re making each hour against what you expected to make by that point in the day. It helps you catch trouble early, while there’s still time to fix it.
A sudden drop in conversion rate – the share of visitors who turn into buyers – is often the first sign that something is broken. That could mean a checkout error, a payment processor failure, or another issue blocking sales.
Check these numbers first, then dig into the source of the drop before more revenue slips away.
How often should I review these KPIs on peak days?
Check your KPIs often on peak days. During your busiest hours, look every 15 minutes. When traffic slows down, every 30 minutes is usually enough.
At a broader level, review performance at least every 30 to 60 minutes so you can spot a problem and fix it within about an hour. For BFCM weekend, plan on twice-daily updates too – one in the morning and one in the evening.
What should I do if mobile conversion suddenly drops?
Check your analytics first. If mobile traffic stays flat but conversions fall, you’re probably dealing with a mobile-only site problem.
That usually means something is breaking in the buying process. Common trouble spots are checkout, payment forms, or slow-loading pages that make people quit before they finish.
If both traffic and conversions drop, look outside the site. Your ad targeting may be off, or a traffic source like Google Ads, Meta, or email may have changed.
Then test the mobile checkout yourself from start to finish. Use your phone, try the full purchase flow, and find the exact step where things go wrong.