Conversion rate is not enough if you run tests on an online store. I’d use revenue per session as the main business check, then pair it with the metric that matches the page or step you changed. Below, I’ll show which metric to use, what each one tells you, and what to check next before you call a test a win.
If I’m testing a product page, I’d start with add-to-cart rate. If I’m testing checkout, I’d start with checkout rate. If I’m testing pricing, bundles, or free shipping, I’d judge the result by revenue per session first.
The short version is simple: match the metric to the funnel step. Then watch one money metric and one stage metric beside it so you don’t miss a drop in sales.
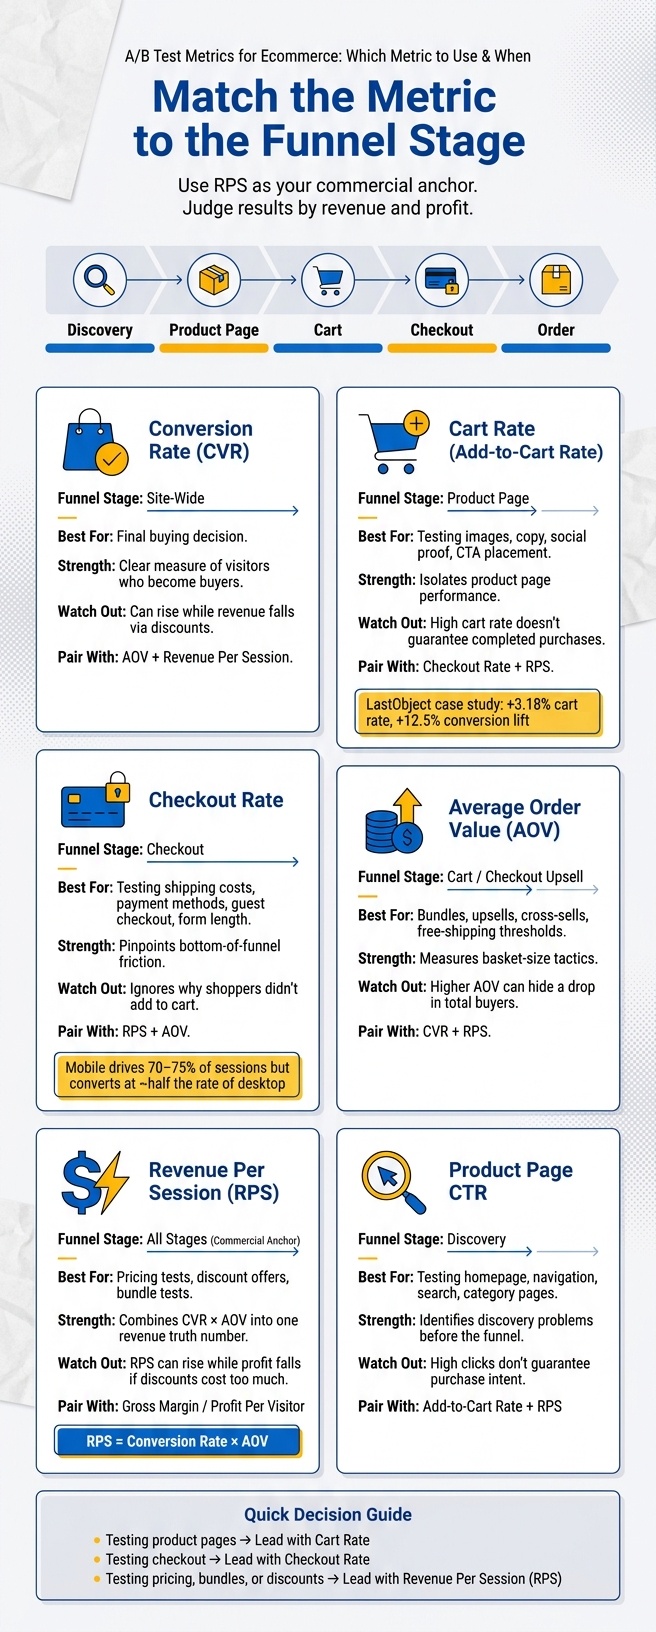
A/B Test Metrics for Ecommerce: Which Metric to Use & When
1. Conversion Rate
Use conversion rate when you need one number tied to the final buying decision. Use stage metrics when you need to see where the funnel breaks. This metric works best on product pages and checkout pages, where buying intent is already high.[6][7][9]
Revenue Guardrail
Don’t judge conversion rate by itself. A higher conversion rate can still cut revenue if discounts pull down AOV – average order value, or the average amount each customer spends per order – so track AOV and revenue per session at the same time.[4][7]
Here’s the plain-English version: more orders only help if those orders still make enough money. If you sell 20% more but your average order drops from $80 to $55, that “win” may not be a win at all.
Find the Drop-Off
When conversion rate falls, check add-to-cart rate and checkout initiation rate next. That shows you where shoppers are bailing out.[5][8]
If the problem starts before people show buying intent, cart rate will tell you more than conversion rate. That’s why cart rate and checkout rate are the next numbers to look at when conversion rate shifts.
Also, split results by device and traffic source. A lift on desktop can hide a drop on mobile, and paid traffic can behave very differently from email or search traffic.[4][9]
Main Risk
The big mistake is chasing conversion rate alone. More orders don’t help if AOV or profit drops.[7]
Use AOV and revenue per session as your guardrails whenever conversion rate is the main metric. If conversion rate moves and you need to see why, check cart rate and checkout rate right after that.
2. Cart Rate
Cart rate tells you if your product page is doing its job. It measures the share of sessions where a shopper adds at least one item to the cart. The formula is simple: sessions with at least one add-to-cart ÷ total sessions.
This is a cleaner metric than conversion rate when you’re testing the product page itself. It shows purchase intent before checkout friction gets in the way.
Best Test Stage
Use cart rate when your test changes the product page. That includes product images, benefit-led copy, social proof placement, or how easy the CTA is to see.
Peter Gardner of Blend Commerce says:
"Add-to-cart rate shows whether product pages create purchase intent. When product page traffic is healthy but cart additions are weak, shoppers may not have enough clarity, confidence, or motivation." [1]
This metric is also useful for mobile tests. For example, if you move delivery promises or reviews closer to the add-to-cart button, cart rate can show whether that change helps.
Revenue Signal
Cart rate shows intent, not sales. It can tell you that more people want the product, but it can’t tell you whether that intent turns into revenue.
For that, you need to watch checkout rate and revenue per session too. Those metrics show whether shoppers finish the job after they add an item.
Diagnostic Value
If product page traffic stays flat but cart additions drop, the issue is likely on the product page. That points you away from checkout and toward the page itself.
In 2022, Danish manufacturer LastObject worked with Ontrack Digital+ to deal with product quality concerns by adding an FAQ section to product pages. The result was a 3.18% increase in add-to-cart rate and a 12.5% lift in overall conversion rate. [10]
Mobile dips often tell the same story. The problem is often layout or content hierarchy – in plain English, the page puts the wrong things first and hides what shoppers need to see.
Main Risk
A higher cart rate can fool you if those carts never turn into orders. That’s why this metric can drift into vanity territory.
A higher cart rate can be a vanity metric if those additions never reach checkout due to high shipping costs or technical errors in the checkout.
Pair cart rate with checkout rate and revenue per session every time. If cart rate goes up but orders don’t, check checkout rate next to find where the funnel breaks.
3. Checkout Rate
Checkout rate tells you how many shoppers who begin checkout go on to buy. The formula is simple: completed orders ÷ checkout starts. It helps you spot friction between buying intent and the final order.
Use this metric when cart adds look good but orders still trail behind. That usually means the problem sits later in the funnel, often in shipping, payment, or account setup. If product-page intent is already strong, checkout rate shows whether the blockage has moved deeper into checkout.
Best Test Stage
Use checkout rate instead of conversion rate when you want to isolate checkout friction. It’s the right metric when shoppers are adding items to cart at a healthy clip, but too many stop before paying.
This is the metric to watch when testing shipping cost displays, delivery promises, payment methods, guest checkout, and form length. If you change anything in the checkout flow, this should be your first read.
Revenue Signal
Checkout rate helps you find the leak. It does not tell you the dollar impact on its own. This is a funnel metric, not a revenue metric. It shows where shoppers drop off, not how much money the fix adds.
For the money side, use revenue per session as your main business check [1]. That gives you the commercial view, while checkout rate tells you where the friction sits.
Diagnostic Value
Checkout friction costs sales fast. Unexpected shipping, taxes, or fees are a common reason shoppers leave [2]. If the final total jumps late in the process, many buyers bail out.
Break checkout rate down by device. Mobile usually drives 70% to 75% of sessions, yet it converts at about half the rate of desktop [3]. That gap tells you where to look first.
On mobile, keep the full amount due visible early. Make guest checkout easy to find. Add one-tap payment options where you can. If checkout rate goes up but revenue still stays flat, check AOV – average order value, or the amount each customer spends per order – next.
4. Average Order Value (AOV)
AOV tells you how much money the average order brings in. Use it when your test is meant to get people to spend more per purchase, like bundles, upsells, cross-sells, subscriptions, or free-shipping minimums. In plain English, AOV is the right metric when you’re changing basket size, not just trying to get more people to buy.
Best Test Stage
Use AOV as your main metric during the "buy more" stage. It fits best for cart bundles, checkout upsells, and free-shipping thresholds because those tests change what people put in the cart.
It also matters more than conversion rate when your goal is to increase order size, such as price tests or selling higher-priced products. If the test changes what shoppers add to an order, let AOV lead the read.
Revenue Signal
AOV helps you see why revenue moved. If revenue goes up and conversion rate stays flat, AOV is probably doing the heavy lifting.
If AOV stays flat and revenue climbs, conversion is likely the reason. Then use RPS to check whether the higher order value actually pushed revenue up.
Diagnostic Value
Use these patterns to make sense of AOV shifts.
| Signal | What It Means | What to Do |
|---|---|---|
| AOV rises, conversion rate stable | Basket-size tactics are working | Roll out the change; look for more upsell chances |
| AOV rises, conversion rate drops | Change is adding friction or turning off smaller buyers | Re-check thresholds or bundle rules |
| AOV stable, conversion rate rises | More buyers, same spend per order | Add cart-page or post-purchase cross-sells to lift AOV |
Main Risk
A higher AOV can hide a drop in buyers. A few large orders can pull the average up while many other shoppers stop buying. When that happens, total revenue can stay flat or even fall.
That’s why you should always check conversion rate and revenue per session next to AOV. If AOV looks good on its own, but conversion rate and RPS don’t, the test may be hurting the business instead of helping it.
The next move is simple: read AOV with conversion rate and RPS every time you test offers that change cart size.[1][2]
5. Revenue Per Session (RPS)
RPS tells you how much money each session brings in. It rolls conversion rate and average order value into one number, which makes it useful when those two metrics are pulling in opposite directions.
This is the metric to use when conversion rate looks better, but order value looks worse, or the other way around. In those cases, RPS gives you the plain answer: did the test make more money per session or not?
Best Test Stage
Use RPS after you’ve already looked at conversion rate and AOV on their own. That way, you can see the net effect on revenue instead of getting stuck on mixed signals.
RPS should be your main metric for pricing tests, free-shipping thresholds, and bundle offers. Those changes often push conversion rate and order value in different directions, so RPS helps you judge the total revenue result. [1]
Revenue Signal
Use RPS when conversion rate and AOV move in opposite directions. If a price increase cuts conversion but lifts AOV, RPS shows whether that trade-off helped or hurt revenue. [1]
Diagnostic Value
Read RPS next to the funnel metrics you’ve already checked. That combo gives you a clearer read on what changed and why.
| Signal | What It Means | What to Do |
|---|---|---|
| CR rises, RPS falls | Discounting is driving orders but hurting revenue | Re-evaluate discount strategy and upsell opportunities |
| AOV rises, CR drops, RPS flat | Bundles or thresholds are adding friction | Test a lower free-shipping threshold or a simpler bundle offer |
| RPS improves, sessions decline | Fewer sessions, but revenue efficiency improved; check channel mix before rollout | Analyze which channels are driving the highest-value traffic |
Main Risk
RPS can go up while profit goes down. That usually happens when discounts or free-shipping offers cost too much.
So don’t read RPS by itself. Check it next to gross margin or profit per visitor to make sure the revenue gain is worth it. [1]
Stick with sessions the whole way through. Don’t switch to visitors partway in, because GA4 and Shopify calculate them differently, and that changes the number. [1]
Next, look at product page click-through rate if your test is meant to move more shoppers into the product page funnel.
6. Product Page Click-Through Rate
Product page click-through rate tells you whether shoppers are actually reaching your product pages. If they don’t get that far, nothing later in the funnel gets better.
This metric tracks the share of sessions that land on a product page from the home page, search, category pages, or merchandising pages. It sits earlier in the journey, so it helps you judge discovery before you look at cart or revenue numbers.
Best Test Stage
Use this metric when your test changes how people find products. That includes the home page, navigation, search, category pages, and merchandising placements.
It should be your main metric when the test affects discovery, not checkout behavior. If you changed where products appear or how shoppers move through the site, this is the right place to look first.
Diagnostic Value
Start with a scatter plot. It helps you spot high-traffic pages with low click-through rates, and those are often your best CRO targets.
If click-through is strong but add-to-cart is weak, the issue usually sits on the product page itself. In plain terms, shoppers are finding the page, but something on that page is stopping them from moving forward.
You should also segment the data by device and traffic source. A healthy sitewide rate can hide a weak spot in mobile paid traffic, where shoppers click through and then leave because the mobile UX – user experience, or how easy the page is to use on a phone – is poor or the page loads too slowly.[1]
Use this pattern to tell apart discovery issues and page-level friction:
| Signal | What It Means | What to Do |
|---|---|---|
| CTR rises, add-to-cart rate flat | Shoppers are finding pages but not converting | Review product page content – pricing, reviews, clarity, or social proof |
| CTR rises, revenue per session rises | Discovery improvement is translating into revenue | Consider rolling out the change |
| CTR rises, revenue per session falls | More clicks, lower-quality traffic | Segment by source; check whether a specific channel is inflating CTR |
Main Risk
A higher click-through rate on its own doesn’t say much. If add-to-cart rate and RPS – revenue per session, or the average dollars earned each visit brings in – stay flat, those extra clicks may not matter.
Track click-through rate next to add-to-cart rate and RPS. That’s how you tell the difference between better discovery and empty clicks that never turn into sales.
The tradeoffs below show where this metric works well and where it can point you in the wrong direction.
Pros, Cons, and Tradeoffs of Each Metric
Use each metric for a specific job. That matters because no single number explains how people shop from start to finish.
Each metric shows one part of the story. The tradeoffs show up fast when results pull in different directions – conversion rate goes up while revenue drops, AOV climbs while orders fall, or product clicks increase with no lift in sales.
The main math here is simple: RPS = Conversion Rate × AOV. [1] If you want to know whether a CVR gain is making you more money, RPS is the check that keeps you honest.
A CVR lift driven by heavy discounting can lower RPS and profit. [1]
Match the metric to the test. Don’t twist the test to fit the metric.
| Metric | Strengths | Weaknesses | Best Role |
|---|---|---|---|
| Conversion Rate (CVR) | Clear measure of how many visitors become buyers | Can rise while revenue falls through discounts or low-margin orders | Site-wide efficiency metric |
| Cart Rate | Isolates product page performance – imagery, reviews, descriptions | High cart rates don’t guarantee completed purchases | Diagnosing product page performance |
| Checkout Rate | Pinpoints bottom-of-funnel friction – shipping costs, payment options, form complexity | Ignores why shoppers didn’t add to cart in the first place | Testing checkout flow changes |
| Average Order Value (AOV) | Measures success of bundles, upsells, and free-shipping thresholds | Higher AOV can add friction that lowers total orders | Optimizing "Buy More" strategies |
| Revenue Per Session (RPS) | Combines conversion and order value into one number; shows true commercial value | Doesn’t pinpoint where in the journey the leak is | Main metric for pricing, discount, and bundle tests |
| Product Page CTR | Identifies navigation and discovery problems before they reach the funnel | High clicks don’t guarantee purchase intent or sales | Optimizing search, menus, and category pages |
Here’s the practical way to use them. If you’re testing for higher AOV, keep an eye on CVR so you don’t hurt order volume. If you’re testing for higher CVR, watch AOV so you don’t win more orders that bring in less money.
When both move the right way, RPS tells you the change is worth rolling out. [1]
Conclusion
Match the metric to the funnel stage. That’s the big takeaway, because conversion rate gives you only part of the picture. A test can push CVR up and still drag AOV down.
Pick one primary metric based on the part of the funnel you’re testing. Then pair it with two or three supporting metrics so you can spot side effects before they hurt sales.
On a product page, lead with add-to-cart rate. Then watch RPS and AOV so you can see whether more carts are turning into more dollars, not just more clicks.
At checkout, lead with checkout completion rate. Keep an eye on RPS too, because a lift only matters if it adds revenue.
Use revenue per session as your anchor when you want the clearest business view. Then pair it with a stage metric and AOV so you can see both the revenue result and where that lift came from.
For store owners, the rule fits on one line: match the metric to the funnel stage, use RPS as your commercial anchor, and judge the result by revenue and profit. Use that as your filter for the next test you run.
FAQs
Which metric should I use first for my A/B test?
Start with the metric that matches your test goal. There isn’t one best metric for every test.
- Use conversion rate, add-to-cart rate, or checkout completion when you want to see if visitors turn into customers.
- Use average order value when you want to know if buyers spend more per order.
- Use product page view rate when you think shoppers aren’t finding the right products.
Pick one main metric before you run the test. That keeps your read on the results clear and stops you from chasing numbers that don’t match the problem you’re trying to fix.
Why isn’t conversion rate enough for an online store?
Conversion rate tells you the end result. It does not tell you why sales went up or down, or where money slips through the cracks.
Used by itself, it can hide weak traffic, low order values, and the exact spots where people drop out of the buying path. That’s a problem if you’re trying to fix the right thing.
You need a few support metrics to see what’s going on. Product page views show whether shoppers are finding your items. Add-to-cart rate shows purchase intent – in plain English, how many people liked a product enough to put it in their cart. Average order value shows how much each order is worth.
These numbers help you pinpoint the issue. If product page views are low, you likely have a discovery problem. If add-to-cart rate is weak, the offer or product page may not be doing its job. If people add items but don’t finish checkout, friction at checkout is the likely culprit.
Check these metrics alongside conversion rate so you can find the leak before you try to fix it.
How do I know if a test increased revenue or just clicks?
Look at revenue per session or per visitor, not just conversion rate. Conversion rate tells you how many orders you got, but revenue per session gives you a better business read because it shows traffic quality, how well the page turns visits into sales, and how much each order is worth.
You should also track average order value. If average order value goes up while conversion rate stays flat, that usually means the test is driving more customer value, not just more clicks or cheap conversions.
Next, check these three numbers side by side before you call any test a win: conversion rate, revenue per session, and average order value.